The five-phase audit: a science agent's working method
An agent audit of a Quantum Caddy simulator ran five phases in a fixed order — reproduce the as-built model, rebuild it from first principles, map the divergence, budget the uncertainty, ship a ranked measurement list. What each phase produced, what breaks it, and how to run it on a demand model or a game economy.
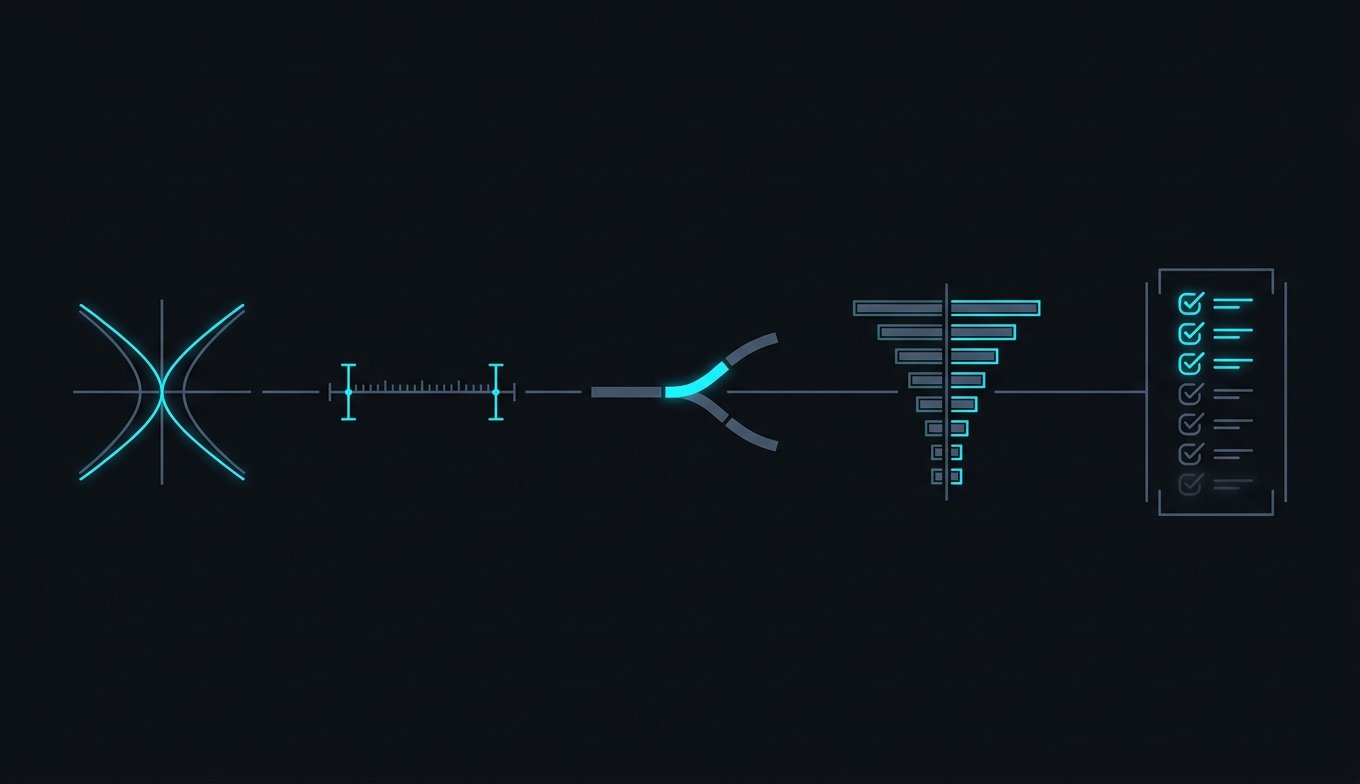
- Each phase manufactures the evidence the next one spends; the order is the method
- The deliverable is a ranked measurement list, not a verdict on the asset
On the evening of July 5th I handed a Claude session a one-page brief and the output of a Quantum Caddy training-data simulator we have since deprecated: tens of millions of simulated cornhole throws, with not one measured throw to check them against. Three hours later the session had reverse-engineered that simulator from its own outputs, rebuilt the physics from first principles, and shown that every maximum-score throw in the grid was an artifact. Field note 0023 tells that story. This piece extracts the method, because the working method mattered more than any single finding, and nothing in it is specific to physics.
The session ran five phases in a fixed order, and the order is the method: each phase manufactures the evidence the next one spends. Below is each phase as it actually ran, what makes it fail, and its generic form for the models most teams actually own — demand models, risk models, game economies.
Reproduce the as-built model from its own outputs
The session's opening move was to ignore every physics question I had asked and reverse-engineer the artifact instead. The simulator's generator script turned out not to be in the repo, and the two sibling generators that were there did not reproduce the shipped data. So the agent fit the grid from the outside and recovered a closed-form model that matched the simulator's flight outputs to about 1.5 percent, published as a per-field fidelity table. That table is the phase's standard of done: fidelity table or it didn't happen.
The phase fails by omission. Skip it, and every later disagreement is ambiguous — a real defect, or your misreading of what the artifact does. It also fails by trust: the code in our repo was not the code that made our data, and reading it as ground truth would have meant auditing a simulator that no longer existed.
The generic version applies to anything that generates numbers you act on. A demand forecast can be fit from the outside, and so can a risk engine's scores or a game economy's drop rates. Lesson 31 walks this phase in depth.
Build the corrected reference from first principles
Only after the as-built model was pinned did the session construct its reference: flight and contact physics derived from first principles, seeded with literature priors, carrying an uncertainty band on every coefficient nobody had measured. Before it touched the comparison it had to pass sanity checks against known limits, terminal velocity among them.
The bands are the load-bearing part. A reference that presents itself as truth just swaps one unvalidated model for another; its authority comes from being independently derived and honestly uncertain, which is what makes later disagreement informative instead of a coin flip.
The failure mode is contamination. Tune the reference until it agrees with the artifact and the divergence vanishes by construction, and the audit measures nothing.
Outside physics, the reference is whatever the published field knows that your deadline code ignored. Elasticities from the literature for a demand model, or industry base rates for a risk model. For a game economy, the designer's intended payout probabilities. Every borrowed coefficient brings its error bar with it.
Map the divergence on a balanced sample
With both models in hand, the session ran them over a balanced six-thousand-throw sample and compared every output, not a summary. In the air the two models agreed almost perfectly, with a median landing difference of 0.01 feet. On scored outcomes, 48.3 percent flipped, and all 2,000 maximum-score throws in the sample died: every one of them rode a slide of roughly three feet that corrected contact physics arrests on the spot.
Two rules fall out of that map. First, where the models split is where the risk lives, and our split was broad across the parameter space, which killed the comfortable theory that one mis-set knob could patch it. Second, agreement in one observable proves nothing about another; near-perfect trajectory agreement sat directly on top of a coin flip in outcomes.
The phase fails when you compare averages instead of drawing the map, and when the sample leans on the regime the artifact was tuned in, where agreement is guaranteed and meaningless.
Generic version: run the same balanced inputs through both models and compare on the output somebody acts on (the credit approval, the reorder quantity, the payout), not the intermediate quantity that is easiest to check.
Budget the uncertainty, then rank what drives it
The fourth phase propagated every uncertain coefficient through the reference model and asked where prediction error concentrates. The answer was lopsided: about two inches of uncertainty on the in-flight landing point, and fifteen inches on where the bag finally comes to rest. A one-at-a-time sensitivity pass then ranked the coefficients, and a single one, board-to-bag friction, drove roughly three times more rest-position swing than any other.
The tornado chart is a spending plan. It says where distrust should live and which measurement to buy first. Ours said friction, and it said so before we spent a dollar measuring anything less valuable.
The phase fails when sensitivity is computed against an output nobody acts on, and when the ranking loses to curiosity, the coefficient that would be fun to measure instead of the one that moves the answer.
Generic version: give every assumed constant a plausible range, push the ranges through the same pipeline, and buy ground truth for whatever swings the decision output most.
Ship a ranked measurement list, not a verdict
The audit did not end in a judgment on the simulator. Its final artifact was a ranked list of six experiments, each tied to the amount of uncertainty it retires. Six is all I will publish about that list, and the count is not the point; the shape is. A verdict closes the conversation and puts whoever built the asset on the defensive. A ranked list opens the next working session, and it made the simulator's builder, me in this case, a collaborator in the fix instead of a defendant.
The phase fails in two directions: a judgment with no next action, or an unranked wish list that amounts to asking for more data.
Generic version: the deliverable is a purchase order for ground truth, ordered by how much decision error each line item retires.
None of it runs without the contract
A closing note for anyone lifting these phases into a brief. They executed because the brief demanded that kind of work: the session ran under an experimentalist contract, no claim without a number, an error bar, and a plot, and a standing obligation to name the measurement that would settle whatever the data could not. Field note 0024 breaks that clause down. Without it, phase one collapses into prose about the code and phase five into hedged suggestions. The five phases are the route. The contract is what keeps an agent walking it when fluent guessing would be cheaper.